Rianne Wagner, Matt Ruark, Natasha Rayne, and Shawn P. Conley
Routine soil sampling is a critical component of any nutrient management plan. When factors like economics and sustainability come into play, both cost and environmental impact can be reduced by applying accurate fertilizer rates. Soil testing remains one of the most valuable tools available to guide these application rates, but unpredictability in phosphorus (P) and potassium (K) soil test levels can complicate the management of these nutrients. While multiple factors contribute to the variability producers observe in P and K test results, seasonal fluctuations in soil test levels can provide a possible explanation. Understanding the seasonal variability in soil P and K levels can guide producers’ soil testing practices and aid in the interpretation of soil test results that exhibit variability between samples.
Soil Test K
Unpublished research performed at the University of Wisconsin-Madison back in 2010 focused on determining the effect of sampling time on soil test K levels. While the difference in soil test K between fall and spring soil sampling dates was not found to be statistically significant when analyzed by site year, the changes were frequently large enough to affect soil test interpretation categories (Vitko et al., 2008). When the data is averaged across soil test categories (Figure 1), a trend is evident that soil test K is higher in the spring for soils in the lower soil test categories and becomes higher in the fall for soils testing in the extremely high category. Soils testing in the very low and low soil test categories in the fall were most impacted by sampling time, as the mean soil test K changes in those categories were significantly greater than zero. Given that each soil test category generally has a range of 30 ppm, a 10-15 ppm increase between fall and spring samples in low and very low soils has the potential to alter the soil test category.
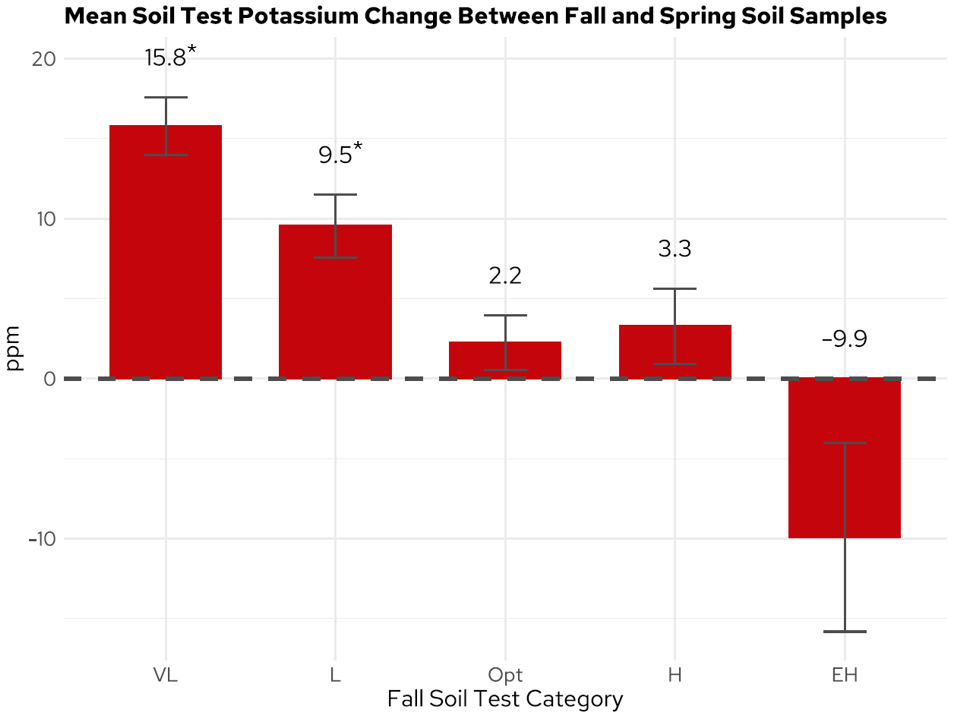
Figure 1. Change in soil test K between fall and spring soil sampling. Positive values indicate that soil test K increased in the spring while negative values indicate that soil test K decreased in the spring compared to fall. *Indicates value is significantly greater than zero (P<0.05). Data from Vitko et al. 2008.
A research study conducted by the University of Kentucky Cooperative Extension also examined seasonal fluctuations in soil K. This study corroborated Wisconsin’s results, with higher soil test K levels observed in the spring compared to the fall (Figure 2). As the corn crop reached physical maturity (black layer), soil test K began an upward trend. Levels continued to increase after harvest, with the March 2005 soil sample having a higher soil test K level than those from October or December 2004. These findings, combined with Wisconsin’s results, demonstrate the seasonal variability of soil test K and support the idea that soil sampling timing can impact soil test K interpretation.
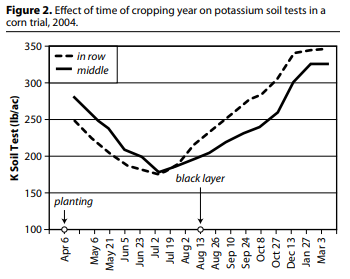
Figure 2. (Murdock & Call, 2006)
There are multiple possible explanations for why changes in soil test K are observed from fall to spring. Precipitation and soil moisture at the time of sampling can greatly affect soil test K results, as moisture additions help release K from harvested crop residue. Since time also facilitates the decomposition of crop residue, spring soil tests may be better able to measure leached K from crop residue than fall soil tests.
Soil mineralogy may also play an important role in seasonal fluctuations of K. Potassium can be released from the interlayers of clay minerals under certain conditions, such as when exchangeable and soil solution K are low or when moisture levels in the soil change. Generally, soils low in K release K from clay interlayers when dried, which increases soil test K levels (Murrell, 2011). The opposite is true for soils high in K, which tend to fix K when dried, resulting in decreased soil test K levels. Once these soils are rewetted, soils that released K when dried maintain their increased K levels. Freeze-thaw cycles affect soil K levels in a similar manner to these wetting and drying cycles, resulting in both cycles contributing to the variability in soil test levels between fall and spring.
Soil Test P
Seasonal fluctuations in soil test P are much less pronounced than those observed for K. In the same study on the seasonal fluctuations of soil test K levels, the University of Kentucky Cooperative Extension also monitored fluctuations in soil P over a growing season. Findings from this study show that soil test P levels increased slightly in the spring compared to the post-harvest fall sampling dates (Figure 3). However, this increase in soil test P was not large enough to significantly impact soil test interpretation between the fall and spring.
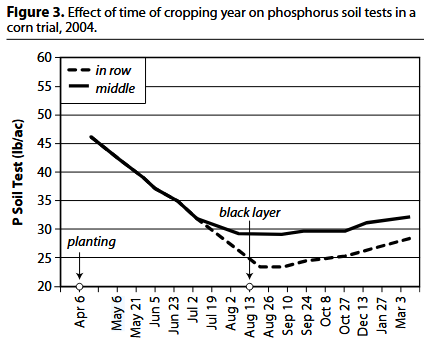
Figure 3. (Murdock & Call, 2006)
In response to Kentucky’s research, Ohio State University Extension performed a similar study to determine if those results were applicable to Ohio growing conditions. Their findings did not confirm Kentucky’s results, as the soil test P levels in the spring were not observed to be larger than the fall post-harvest levels (Culman et al., 2015). Given that no significant difference between fall and spring soil P levels has been found, it cannot be concluded that sampling time influences soil test P levels.
When attempting to increase the accuracy of soil test P results, management practices appear to have a much larger impact on variability than soil test timing. Common examples of P variability due to management practices are vertical stratification of P in reduced tillage systems, spatial variation created by band placement of P, and uneven nutrient applications (Beegle, 2005). If variability in soil test P results is a concern, utilizing proper sampling techniques is the best way to ensure accurate soil test results.
Best Soil Testing Practices
While there is evidence that soil sampling in the spring vs. fall can affect soil test K levels, this doesn’t automatically mean that all producers should modify their soil sampling schedules. Fall soil sampling is popular for good reason; it offers good sampling weather and ample time to plan for the upcoming growing season. In order to ensure that fall soil samples accurately reflect soil test K levels, it is recommended to avoid sampling immediately post-harvest. Delaying sampling in the fall allows for time and precipitation events to assist in the decomposition of crop residue and leaching of K into the soil, providing a more accurate reflection of available K. If deciding to soil sample in the spring, it’s important to recognize the possibility that soil test K levels and categories may differ from previous fall soil samples, especially for lower testing soils. Although further research is needed before issuing a definitive recommendation, switching to spring sampling for soils low in K may reduce fertilizer rate recommendations if spring soil test values increase enough to shift the soil test category.
Regardless of when soil samples are taken, best soil sampling practices should be followed to ensure the most accurate results possible. UW-Extension currently recommends that for every 5 acres, producers collect a composite soil sample consisting of 10-20 cores taken from a depth of 6-8 inches (Peters & Laboski, 2022). On fields where P or K fertilizer has been applied in a band, double the amount of soil cores should be taken to avoid inflated soil test values. To ensure that P and K levels are accurate in reduced tillage systems, a consistent sampling depth should be maintained. Whether soil sampling is performed in the spring or fall, sampling at the same time of year is recommended to reduce the variability in soil test interpretation. If deciding to modify current soil sampling schedules, being aware of seasonal variation in soil test values can aid in the interpretation of test results.
Although soil testing isn’t perfect, it can be a useful estimate of the probability that an application of P or K will lead to a profitable yield increase. Based on UW-Extension’s soil testing philosophy, the goal is to maintain soil test levels in the optimum range where recommended application rates are equal to the removal rate in the harvested portion of the crop. As consistency will lead to better decision making, performing routine soil tests, regardless of timing, is the best way to monitor soil test levels and guide fertilizer application rates.
Bibliography
Beegle, D. (2005). Assessing Soil Phosphorus for Crop Production by Soil Testing. In Phosphorus: Agriculture and the Environment (pp. 123–143). John Wiley & Sons, Ltd. https://doi.org/10.2134/agronmonogr46.c5
Culman, S., LaBarge, G., & Lentz, E. (2015). Soil Sampling in the Spring vs. Fall. Ohio State University Extension. Agronomic Crops Network. https://agcrops.osu.edu/newsletter/corn-newsletter/2015-31/soil-sampling-spring-vs-fall
Murdock, L., & Call, D. (2006). AGR-189: Managing Seasonal Fluctuations of Soil Tests.
Murrell, S. (2011). Why are Soil Test Potassium Levels So Variable Over Time in the Corn Belt? https://www.sciencesocieties.org/files/certifications/certified/education/self-study/exam-pdfs/155.pdf
Peters, J. B., & Laboski, C. A. M. (2022). Sampling Soils for Testing (A2100).
Vitko, L. F., Laboski, C. A. M., & Andraski. (2008). Effect of Sampling Time on Soil Test Potassium Levels. Proceedings of the 2008 Wisconsin Fertilizer, Aglime. https://extension.soils.wisc.edu/wp-content/uploads/sites/68/2014/02/2010_wcmc_proc.pdf#page=40