Spyridon Mourtzinis, Shawn P. Conley, Maninder P. Singh, Chad Lee, Alexander Lindsey, and Harkirat Kaur.
In a bean pod
– The best corn RM for top yields across the U.S. ranges from 78 to 118 days.
– Potential growing season length depends on how much frost risk a farmer is willing to take.
– A farmer’s tolerance for frost risk can affect which corn maturity they choose to plant.
Adapted from: Mourtzinis, S., Conley, S., Singh, M. P., Lee, C., Lindsey, A., & Kaur, H. (2025). Determining high yielding corn relative maturities and growing season characteristics across the United States. Agronomy Journal, e70194. https://doi.org/10.1002/agj2.70194
Introduction
Even though growing seasons have been getting warmer since 2000, farmers haven’t always switched to longer-maturity corn hybrids to match (Abendroth et al. 2021). Farmers in regions north of 43°N latitude have generally increased RM (Relative Maturity) selections over time, whereas most US farmers south of this latitude have shortened RM selection relative to gains in season length. While some states have their own recommendations for high-yielding RM (e.g., Agyei et al., 2025), there is lack of a consolidated map for optimum corn RM for greatest grain yield and growing season characteristics such as first frost-free in the spring and last frost-free in the fall and cumulative GDD (Growing Degree Days) based on growing season length across the US. Therefore, the objectives in this study were to determine (i) optimum corn RM for high grain yield across the US and (ii) determine growing season length and cumulative GDD across the US based on different frost probability thresholds.
Materials and Methods
Corn yield data from variety performance trials from 30 states across the US (Fig. 1) and for periods up to 10 yr (2014 to 2023), were collected. The RM with the maximum yield in every trial was recorded and was considered as “optimum”. Using these results, a new database was constructed including the location–year–specific optimum RM, latitude, longitude information. A mixed model with latitude, longitude, their interactions, and their quadratic forms as fixed effects was fitted and predictions were used to develop a contour map of optimum corn RM zones across the examined region. For each county, using two different probability thresholds (50 and 10% frost probability), the frost-free growing season and growing degree units (GDDs) were identified across the examined region.
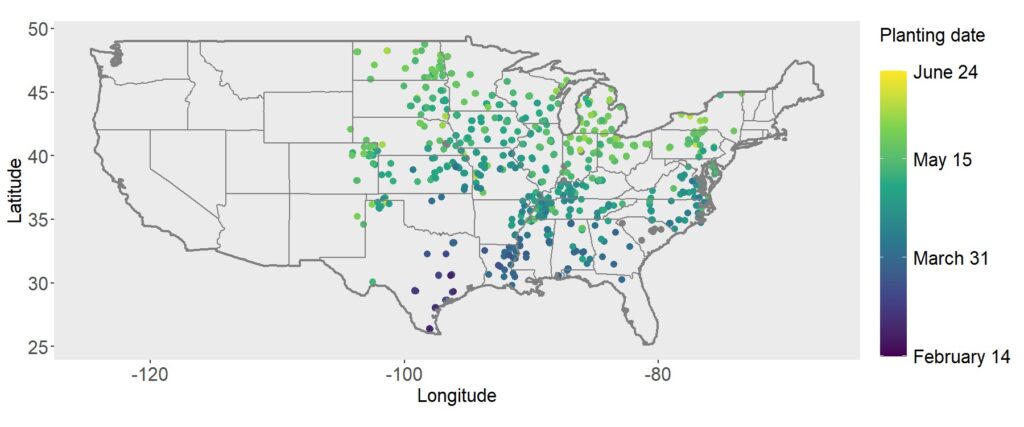
Fig. 1. Locations across the continental United States from which corn yield hybrid trials data were used. Blue to yellow color gradient shows the average planting dates in each trial across years. Trials with gray color have missing planting date information.
Results
Corn relative maturity zones for greatest yield
The map with corn RM zones (Fig 2) shows that hybrids with RM 78-86 are best adapted to the northern part of North Dakota. The southern part of the state and the northern part of Minnesota are better suited for RM between 88 and 92. Hybrids with RM values of 92 to 102 are better adapted in South Dakota and southern Minnesota. The RM ranging between 92 and 106 or 107 are better adapted in Wisconsin and Michigan, respectively. Results suggest that RM between 104 and 114 are better adapted in major corn producing states such as Nebraska, Iowa, Illinois, Indiana, Ohio and Missouri. Values of RM between 112 and 116 are better suited in Kansas, Kentucky and North Carolina. In the rest of the southern states, RM between 116 and 118 are better adapted. While a north-south gradient exists within the current analysis regarding optimum RM selection, the contour lines suggest latitude alone is an insufficient determinator of optimum corn hybrid RM to maximize grain yield.
All optimum RM estimates are associated with uncertainty which ranges between 0.4 to 1.5 units. Greater uncertainties were observed in regions with lack of available data such as North Dakota, western part of Texas and most of Florida (Fig. 2). Estimates in most midwestern states, with multiple hybrid trials, were associated with a standard error of approximately 0.5 RM units.
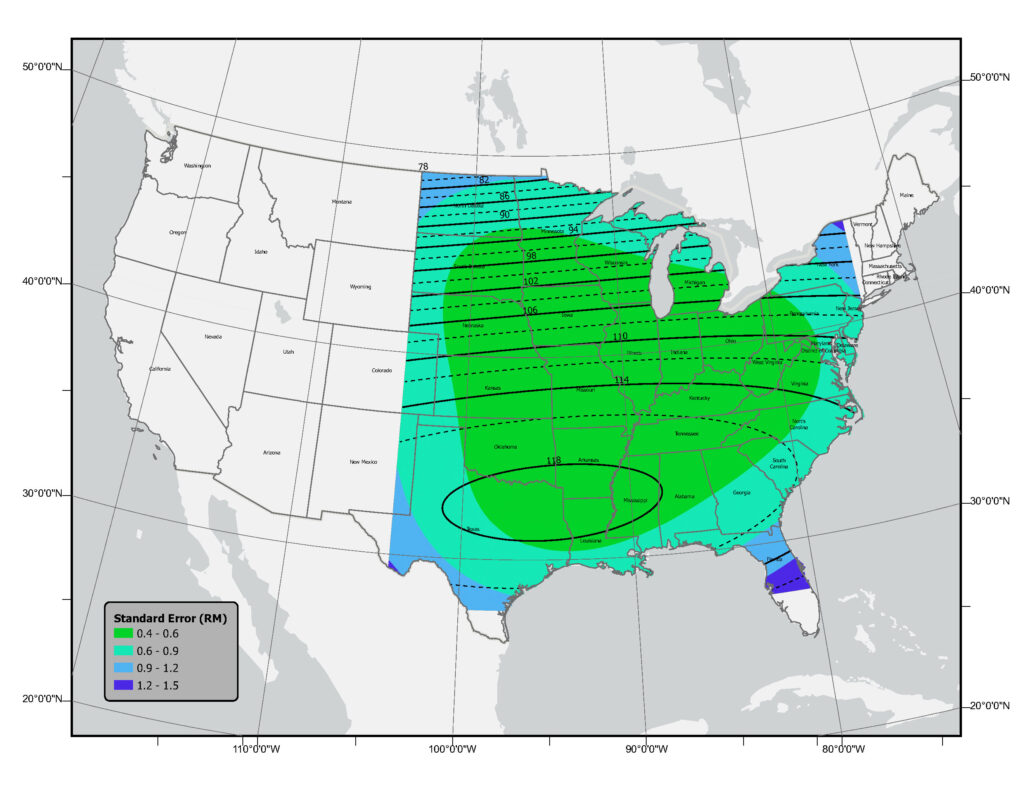
Fig. 2. Optimal corn maturity zones for greatest yield across the examined region of the continental United States. Color gradient from green to blue shows increasing standard error of prediction.
Growing season characteristics
The first frost-free date (defined as the first day with minimum temperature > 28oF) varied across the continental US (Fig. 3). In many southern states the first frost-free date (50% frost probability) was observed in early January to late February and reached mid to late May in North Dakota and northern Minnesota. For the 10% frost probability threshold, the first frost-free date shifted later by up to 5 days in most states. Larger shifts were observed in northern Minnesota, Wisconsin, Michigan, New York, the Appalachian Mountain Range (from New York to Alabama), parts of the coastal regions, and Texas.
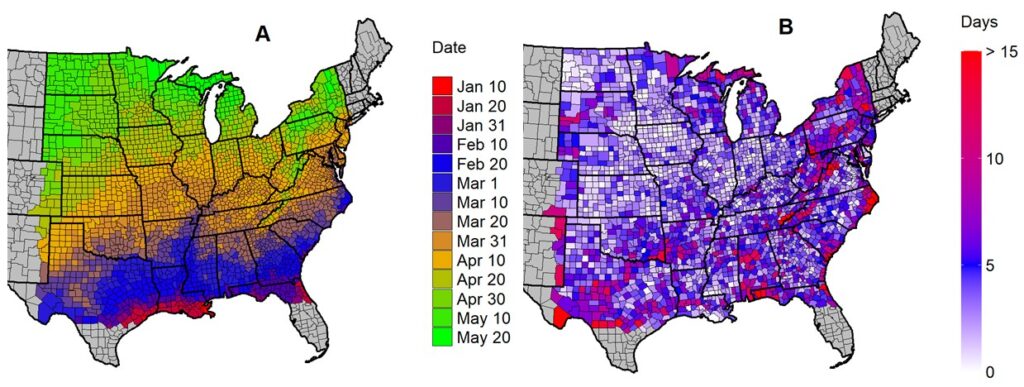
Fig. 3. First frost-free day (defined as the first day with minimum temperature > 28oF) across the United States for two frost probability thresholds. A) 50% probability threshold, with dates grouped in 10-d intervals starting from January 1 (e.g., “Jan 10” represents the period from January 1 to January 10). B) 10% probability threshold, with values representing the number of days after the 50% date shown in panel A to achieve this. Data are based on 25-year averages (1999–2023).
A similar north-south gradient was observed for the estimated last frost-free dates across the US (Fig. 4). In many northern states the last frost-free date (50% probability threshold) was observed in early to late October and reached late December in the southern states. For the 10% frost probability threshold, the last frost-free date in the fall shifted earlier by up to 5 days across most of the region.
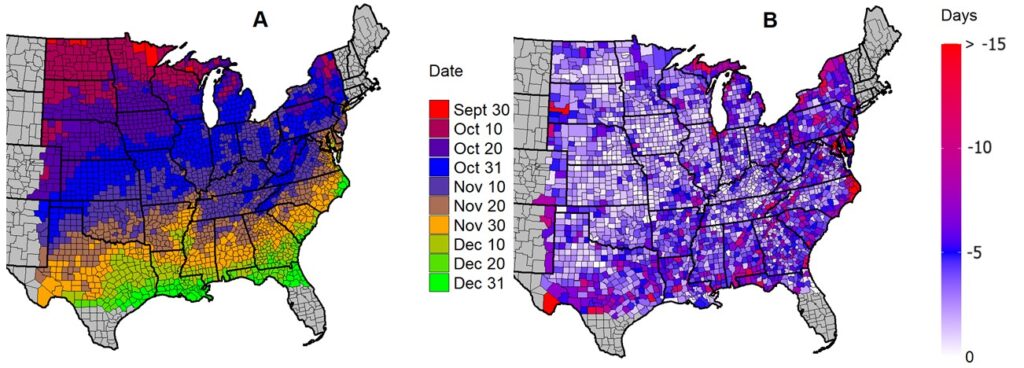
Fig. 4. Last frost-free day (defined as the last day with minimum temperature > 28oF) across the United States for two frost probability thresholds. A) 50% probability threshold with dates grouped into 10-day intervals starting from September 20 (e.g., “Sept 30” represents the period from September 21 to September 30). B) 10% probability threshold where values represent the number of days earlier than the 50% threshold values shown in panel A to achieve this. Data are based on 25-year averages (1999–2023).
The estimated frost-free season length also varied due to differences in first and last frost-free dates among regions and selected frost probability thresholds (Fig. 5). For 50% frost probability threshold, in many northern states the frost-free season length was estimated to be between approximately 140 to 185 days and extended to 365 in parts of the southern states. For the 10% frost probability threshold, frost-free season length was reduced by up to 5 to 10 days across most of the region.
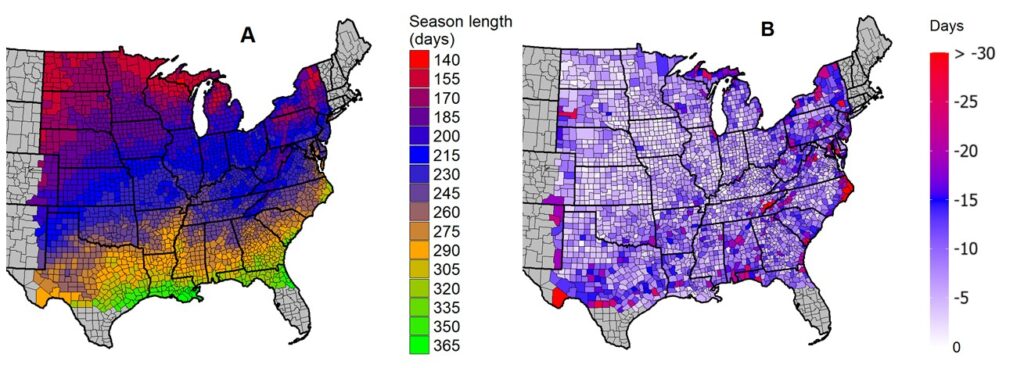
Fig. 5. Frost-free season length (in days) across the U.S. for two frost probability thresholds, based on minimum temperature > 28oF. A) 50% probability threshold with season length grouped into 15-day intervals. B) 10% probability threshold where values represent the number of days of shorter season length than the 50% threshold values shown in panel A. Season length is calculated as the difference between the last and first frost-free day in Fig 4 and 3 respectively. Data are based on 25-year averages (1999–2023).
Growing degree day accumulation decreased as latitude increased (Fig. 6). The accumulated GDDs between first and last frost-free dates for different probability thresholds ranged between 800 to 1000 heat units (northern states) up to 3900 (southern states). Within the same region, at 10% frost probability threshold, minimal cumulative GDDs reductions were observed for most of the region.
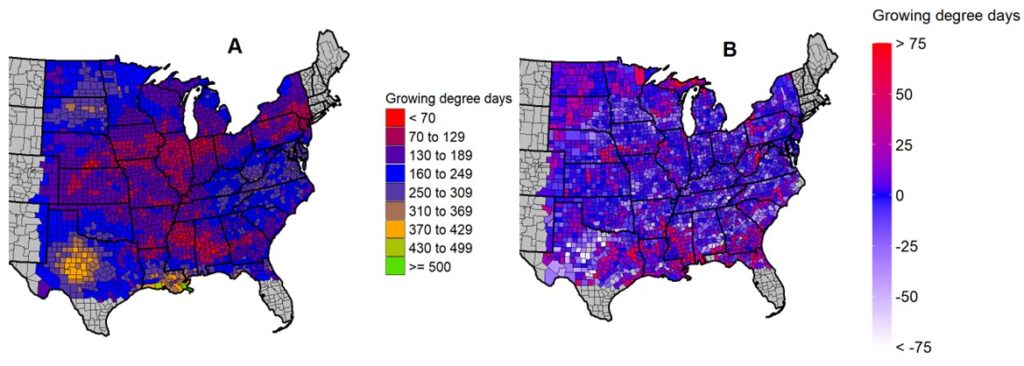
Fig. 6. Average growing degree days (GDD) across the U.S. between 2019 and 2023 for two frost probability thresholds, based on minimum temperature > 28oF. A) 50% probability threshold with GDD values grouped into 200-unit intervals. B) 10% probability threshold where values represent the reduction in GDD than the 50% threshold values shown in panel A.
County-specific accumulated GDD varied by 70 to 500 units between 2019 to 2023 (Fig. 7). The variability across most midwestern states was low (< 25 GDD) and greater year-to-year differences were observed in North and South Dakota, Minnesota and southern states. At the 10% frost probability threshold, growing degree day variability remained comparable to the 50% threshold, with differences typically within ±25 GDD across most states.
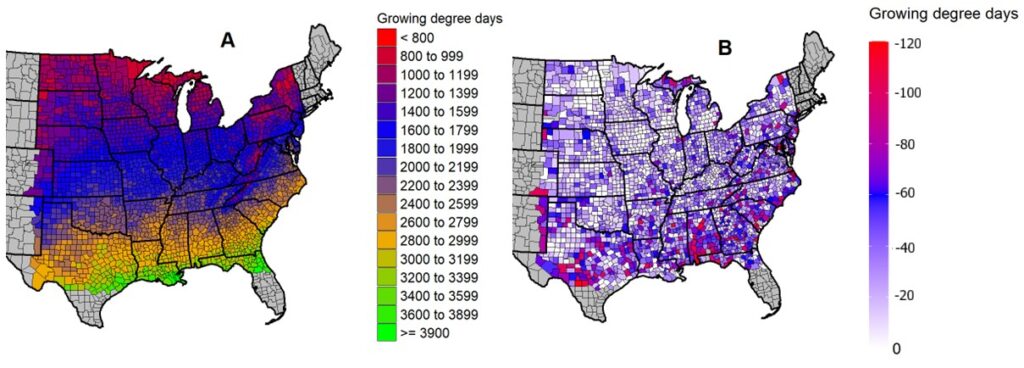
Fig. 7. Variability in cumulative growing degree day (GDD) totals across the U.S. from 2019 to 2023 for two frost probability thresholds, based on minimum temperature > 28oF. A) 50% probability threshold with GDD values grouped into 60-unit intervals. B) 10% probability threshold where values represent the difference in GDD than the 50% threshold values shown in panel A.
Conclusions
Hybrid RM choice is an important management decision that can affect final yield. Informed decisions require knowledge and understanding of growing season characteristics. In this work, optimum RMs for high yield across the US were identified. Additionally, spring first and fall last frost-free dates, growing season length and total GDD for different frost probability thresholds across the US at the county level were identified. Overall results suggest that farmer risk aversion characteristics can affect the anticipated length of growing season and total GDDs which in turn can affect RM choice. Farmers can leverage the findings of this study to assess the characteristics of the growing season in their region and make informed farming decisions tailored to their level of risk aversion. Future work examining corn profitability using kernel moisture data along with planting date and RM interactions can further aid in optimizing such important decisions.
References
Abendroth, J. J., Miguez, F.E., Catellano, M. J., Carter, P. R., Messina, C. D., Dixon, P. M., & Hatfield, J. L. (2021). Lengthening of maize maturity time is not a widespread climate change adaptation strategy in the US Midwest. Glob. Change Biol. 27:2426-2440. https://doi.org/10.1111/gcb.15565
Agyei, B.K., Mourtzinis, S. & Singh, P.M. (2025) Maximizing corn yield and partial returns in Michigan by optimizing hybrid maturity selection. Crop Forage & Turfgrass Mgmt. 2025;11:e70033


